Have you ever checked your sleep tracker and wondered whether your sleep efficiency was actually good?
A percentage like 82%, 88%, or 94% doesn’t mean much without something to compare it with. That’s why a Sleep Efficiency Chart can be so helpful.
Instead of looking at a number alone, a sleep efficiency chart lets you see where your result falls on a simple scale. It helps you understand how efficiently you’re sleeping and whether there may be room to improve your bedtime routine.
Whether you use a smartwatch, fitness tracker, sleep diary, or an online calculator, this chart provides an easy way to interpret your sleep efficiency percentage.
What Is a Sleep Efficiency Chart?
Quick Answer
A Sleep Efficiency Chart is a simple reference table that helps you interpret your sleep efficiency percentage.
It compares the amount of time you spend asleep with the total time you spend in bed and groups the result into easy-to-understand ranges.
How Is Sleep Efficiency Calculated?
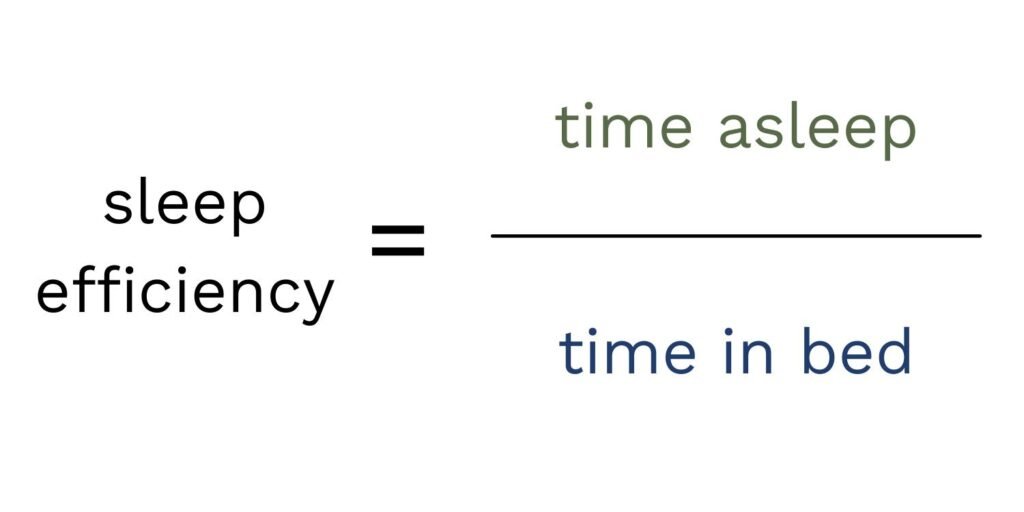
Sleep efficiency is calculated using this formula:
Sleep Efficiency (%) = (Total Sleep Time ÷ Total Time in Bed) × 100
Example
Suppose you:
- Spend 8 hours in bed
- Sleep for 7 hours
Calculation:
7 ÷ 8 × 100 = 87.5%
According to most sleep efficiency charts, 87.5% generally falls within the Good range.
Sleep Efficiency Chart
| Sleep Efficiency | General Rating | What It Means |
| 95–100% | Excellent | Most time in bed is spent sleeping |
| 90–94% | Very Good | Healthy sleep efficiency for many adults |
| 85–89% | Good | Generally considered a healthy range |
| 80–84% | Fair | Some time awake during the night |
| Below 80% | Lower Sleep Efficiency | More time awake while in bed |
These categories are general guidelines and should not be used as a medical diagnosis.
Why Use a Sleep Efficiency Chart?
Quick Answer
A sleep efficiency chart makes your sleep percentage easier to understand.
Instead of asking whether 86% or 91% is good, you can quickly compare your result with standard ranges.
Tracking your score over time may help you:
- Monitor sleep consistency
- Identify changes in sleep habits
- Compare weekly trends
- Measure improvements in your bedtime routine
Helpful Sleep Tools
If you’re tracking your sleep, these tools work well together:
A Sleep Calculator helps estimate ideal bedtimes and wake-up times based on complete sleep cycles, while a Nap Calculator helps schedule naps that fit your daily routine.
Example Sleep Efficiency Calculations
Here are a few practical examples.
| Time in Bed | Time Asleep | Sleep Efficiency |
| 8 hrs | 8 hrs | 100% |
| 8 hrs | 7.5 hrs | 93.8% |
| 8 hrs | 7 hrs | 87.5% |
| 8 hrs | 6.5 hrs | 81.3% |
| 7 hrs | 6 hrs | 85.7% |
These examples show that even small periods spent awake can noticeably change your sleep efficiency percentage.
What Can Lower Sleep Efficiency?
Several everyday habits may reduce your sleep efficiency.
Common examples include:
- Irregular bedtimes
- Long periods awake before falling asleep
- Frequent nighttime awakenings
- Late caffeine intake
- Excessive evening screen time
- A noisy bedroom
Making small improvements to these habits may help increase your sleep efficiency over time.

How Can You Improve Your Sleep Efficiency?
Maintain a Consistent Schedule
Go to bed and wake up at approximately the same time each day.
Create a Better Sleep Environment
Aim for:
- A cool bedroom
- Comfortable bedding
- Minimal light
- Quiet surroundings
Reduce Evening Screen Time
Limiting screen exposure before bedtime may help you fall asleep more easily.
Track Your Sleep Regularly
Recording your sleep helps you compare your results using a sleep efficiency chart over weeks and months.
Can Naps Affect Sleep Efficiency?
Yes.
Long afternoon naps may make it harder for some people to fall asleep at night.
A Nap Calculator can help estimate an appropriate nap duration while supporting your nighttime sleep routine.
What About Jet Lag?
Travel across multiple time zones may temporarily reduce your sleep efficiency while your body adjusts.
A Jet Lag Calculator can help estimate recovery time as your circadian rhythm gradually returns to normal.
Frequently Asked Questions
What is a Sleep Efficiency Chart?
A Sleep Efficiency Chart helps interpret your sleep efficiency percentage by comparing it with commonly used ranges.
What is considered a good sleep efficiency percentage?
Many sleep specialists consider 85% or higher to represent generally healthy sleep efficiency.
How do I calculate sleep efficiency?
Use this formula:
Sleep Efficiency (%) = Total Sleep Time ÷ Total Time in Bed × 100
Does spending more time in bed improve sleep efficiency?
Not always. Spending extra time awake in bed may actually lower your sleep efficiency.
Can sleep trackers show sleep efficiency?
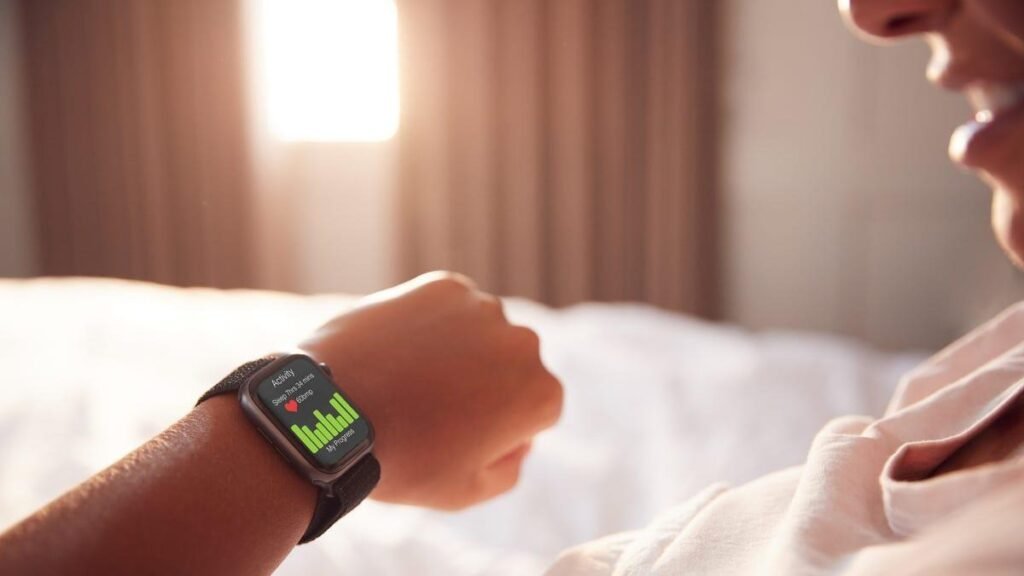
Yes. Many smartwatches and sleep tracking apps automatically estimate sleep efficiency.
Conclusion
A Sleep Efficiency Chart makes it easy to understand what your sleep efficiency percentage means. By comparing your results with commonly used ranges, you can better monitor your sleep habits, recognize patterns, and make gradual improvements to your bedtime routine.
Combined with practical sleep planning tools and consistent daily habits, tracking your sleep efficiency over time can help you build a healthier and more consistent sleep schedule.